Pirate Metrics Canvas
When you are developing a new digital service or startup, it is vital to understand how you will reach your customers. The Pirate Metrics Canvas helps you make sense of this process.
Use this tool when:
- you want to work towards product market fit
- you want to understand how you attract and convert customers
- you want to understand how you can increase referral and retention
Overview
| Time | ± 45 minutes | |
| Difficulty | 3 / 5 | |
| People | 3 - 5 | |
| Author | erik van der pluijm | |
| Website | ||
| License | CC BY SA 4.0 |
What is it and when should I use it?
When you are developing a new digital service or startup, it is vital to understand how you will reach your customers. And to do that, according to the originator of Pirate Metrics, Dave McClure, who first presented it in 2007 at Ignite Seattle, it’s best to think like a pirate.
Example The video of the original presentation of Pirate Metrics in 2007
The idea is to map out the entire journey a customer makes to go from someone who doesn’t know the service at all through different stages to someone that is a paying customer. What are the different stages a customer goes through? What are the decision points? What are the conversion rates between subsequent stages?
Knowing this will help you calculate those all important metrics: the CAC (Cost of Acquiring a Customer) and the CLTV (Customer Lifetime Value). If you know your CAC and CLTV, you also know what your profit margin is.
A customer has to go through these stages to go from someone that does not know about the service all the way to a customer that generates revenue. Each of the transitions between stages has a conversion attached to it. Not all customers that you acquire end up using the service, and not all of these may become paying customers. That means, you will lose customers going from stage to stage.
To get more paying customers, you can do two things. You can get more customers into the system (by working on the acquisition stage), and you can increase the conversion rates on each of the stage gates. Both strategies, typically, come with a cost. The total cost that you incur in order to get a customer from the acquisition phase to a paying customer is what determines your CAC.
Strategic Questions
Typically, this means early stage startups have questions such as:
- What are the channels we have available to acquire customers?
- What strategies can we use to influence the conversion rates between stages?
- Where should we spend our money in order to lower CAC, raise CLTV, and increase user growth?
- Should we focus on getting more active users? Or more paying customers?
Strategically, finding the answers to these questions is super important. That means that discussing the current state of the Pirate Funnel and the strategies to the future should be an integral part of the innovation journey, especially once you start to work towards product-market fit.
To enable that discussion and make it easier to keep track of the current situation and the focus for the near future it is super helpful to have a visual aid for team discussion that you can come back to check later: a canvas.
I have turned the original idea into a canvas that you can use to make sense of what the Pirate Funnel looks like for your service or startup.
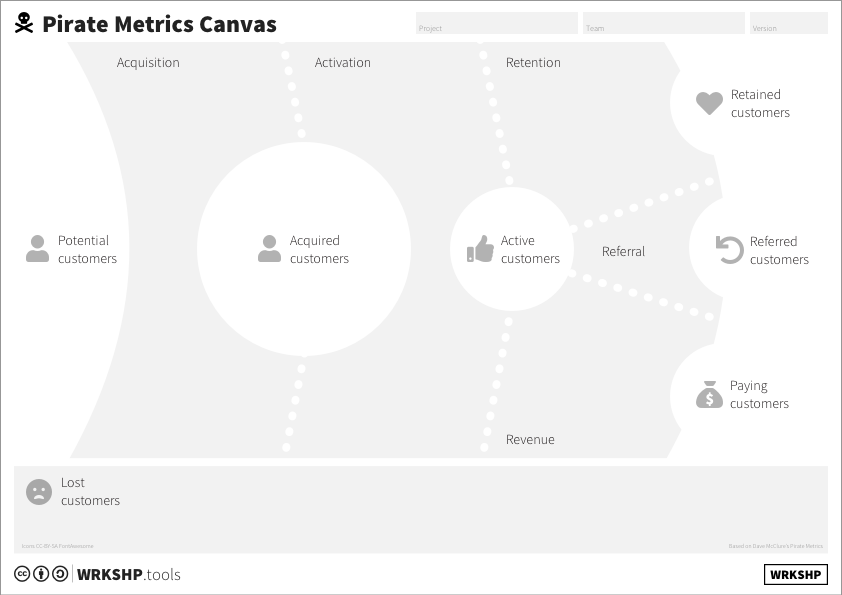
Tool Overview
Potential customers Anyone that may be interested in the service
Acquisition The activities you do to reach potential customers
Acquired customers People that have engaged with your product or service
Activation The activities that turn engaged people into actual users
Active customers People that are actively using your service
Retention The activities that make people come back to your service
Retained customers The people that come back to use your service again
Referral The activities that make people refer your service to others
Referred customers People that have been referred to your service
Revenue The actions you take that make people want to pay for your service
Paying customers People that pay for the service
Lost customers Customers that were lost in conversion steps (grey)
Steps
1 Fill in what you know
The canvas is best used with a small team. Fill in the canvas the first time with what you know or guesstimates, and keep updating it during the innovation journey with real data to see how you might improve. The first pass of the canvas is to fill in what you know already.
2 Potential customers
Find out how many Potential Customers your market has (roughly). Use demographics or for instance Facebook’s audience targeting system to get an idea of the maximum number of people you might reach. Stick these numbers on post-its in the potential customers area. It may be helpful to define customer segments when they have different preferred channels. Next, find out how many of these potential customers you can already reach. What are the channels you already have (or would like to have) to reach potential customers? How many people interact with these channels? List them as well. This is probably a lower total amount. Think of channels such as:
- Your existing website and social media
- Partner websites and social media
- Advertising
- Blogs
- ...
3 Acquisition
Define what ‘acquisition’ means for your situation. When do you count a customer as acquired? When they end up on your landing page? When they are on your email list? When they open the App Store page? Or something else?
For different channels, list conversion rates. How many people in the channel can you direct towards your service? If you place an ad, how many people click on it? If you write a blog, how many people read it? Try to find the typical conversion rates from your data (if you have it), or find appropriate benchmarks online. Later you’ll be able to figure out what the actual rates are.
Using the conversion rates for each channel, figure out how many of the potential customers made it to the 'acquired customer' stage. How many people make it to your landing page? The rest has left and ended up in the ‘lost customers’ box.
4 Activation
Define what ‘activation’ means for your situation. When do you count a customer as active? When they download and install your beta? When they posted on your forum? It has to be an activity they perform at least once and that is specific to what you’re selling.
How many people will become active users of your service? Find conversion numbers in your data or look for suitable benchmarks online. Later you’ll be able to figure out what the actual rates are.
5 Retention, Referral, and Revenue
Here it becomes a bit more complex. Each Activated customer can end up in zero, one, two, or even all three of the boxes to the right.
5A Retention
This is the most obvious step to look at. How many active customers come back to use the service again. When they come back, that means the service has value for them. They are obviously happy about at least some aspects. Improving this rate means you are able to zoom in on how you deliver value to the customer, and how you make your service addictive (Check out the awesome book Hooked by Nir Eyal to read more about addictive services).
Retention is a really important metric, especially for subscription based models. Most successful businesses get upwards of 70% of their revenue from loyal customers, and improving retention (lowering churn) by even 5% can mean a difference of 95% in your revenue.
Tip! The longer a customer stays in a subscription model, the higher their CLTV will be, and therefore, relatively, the lower their CAC is.
Tip! Important metrics startups use that are influenced by retention are ‘daily active users’ and ‘churn’.
Again, try to get numbers from the data you have, or look at online benchmarks. Calculate how many users will be retained based on the number of active users and the retention rate.
5B Referral
This is arguably the most important thing to look at if you want high growth and lower CAC. Dropbox famously influenced their referral rates by giving free storage for bringing in new users. Referrals mean free advertising. People referring your service give it a warm introduction to others: their referral is much more likely to be trusted. It also means that people need to be quite convinced of how much they like your service before they refer it.
As before, try to get numbers from the data you have, or look at online benchmarks. Also come up with an idea of how many people they will refer. When they take the decision to refer people, and especially when there is an incentive such as with Dropbox, they will likely refer more than one person.
How many people will be referred to your service? This is a function of the number of active users, the referral rate, and the number of people referred on average.
5C Revenue
This is the bottom line. How many people end up paying for the service. If you have a freemium model, for instance, not every active user may be a paying customer. Again, come up with a conversion rate.
Again, come up with a conversion rate. Calculate how many people will pay for the service.
6 Strengths and Weaknesses
Now that you have filled the canvas, take a step back. With the team, identify strengths and weaknesses. Where are you doing better or worse than your benchmarks? Where do you have missing information? Mark these out with coloured dots. Then, go over each step. For each step:
- Come up with 3 ways to influence the conversion rate (negatively or positively). This could be adding a different channel, sending a personal message, making something easier to understand, …
- Come up with 3 reasons for a customer to convert to the next stage.
- Come up with 3 reasons for a customer to become a lost customer. Try to focus on things you can influence.
Stick these on the board on post-its.
Note that in some cases it’s great that people don’t convert: if you already know a person is not going to be an active customer, for instance, it’s better they don’t pass the acquisition stage. The funnel is also a filter to find those customers that are the best fit for your service.
7 Define Experiments
Use the strong/weak spots and your calculated numbers to find likely candidates for improvement. Where can you influence the end result in the most effective way? That should be your focus for the near future.
Also, if you haven’t done so, setup the necessary tooling to measure the different transitions and stages in your model.
8 Next Steps
After a month or so, revisit your canvas, and update the numbers with real data. What have you learned? Where were your numbers spot on? Where were they way off? Try to see if you understand what is going on. And then iterate: find the next weak spot, and define a new experiment.