Trend Canvas
The Trend Canvas helps you map different trends in the world around your business that may impact you in the future.
Use this tool when:
- you want to map or track different trends in the world around you.
Overview
| Time | ± 30 minutes | |
| Difficulty | 2 / 5 | |
| People | 3 - 5 | |
| Author | erik van der pluijm | |
| Website | ||
| License | CC BY SA 4.0 |
What is it and when should I use it?
When coming up with new directions for innovation, or when you’re taking the first steps on your startup journey, it’s all about understanding the problem you want to solve.
And that requires making sense of a lot of incoming information. Not just information about your customer (see Customer Needs Canvas, Persona Canvas, and Customer Journey Canvas for that), but also information about the state of the world around you.
You’ll probably also do market research, look at competitors, get insights on trends and technological developments, and try to divine what the future may hold in terms of e.g. economic development, environmental change, and legislation.
After all, the product or company you want to build does not exist in isolation. It is connected to the outside world, and it is influenced by it. If you don’t know about that new piece of legislation that will cripple your business model and that is coming next year, you’ll be in trouble. Understanding the context of your business is crucial.
How do you bring together that information, and how do you represent it in such a way that you and your team can build a shared mental map? That is where the Trend Canvas comes in.
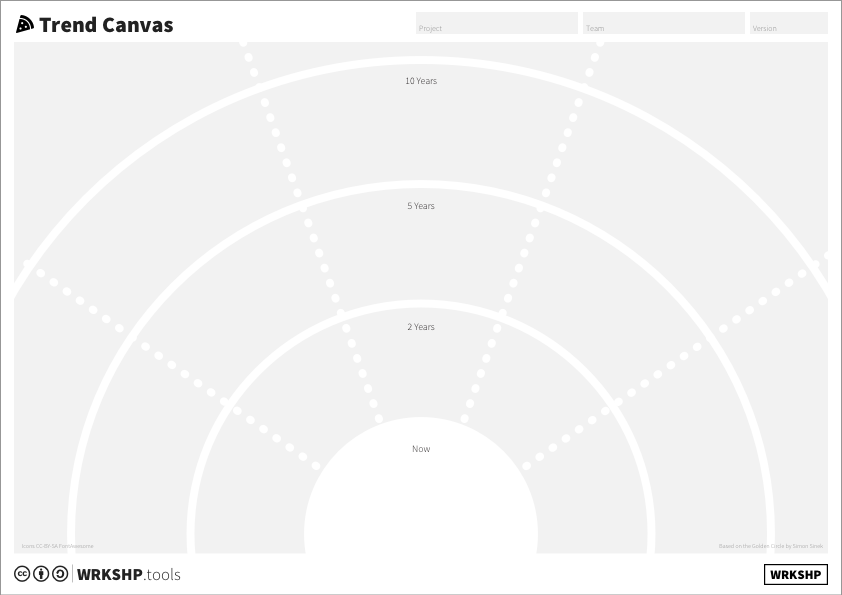
Tool Overview
Now Trends you see in the world today.
2 Years Trends you expect to become big in the next 2 years.
5 Years Trends you think might show up in 5 years time.
10 Years Long term patterns and scenarios that might play out.
Steps
1 Collect Trends
The first step to mapping the world around you is to find relevant information and make sense of it. There needs to be a sorting principle at work. One great way to do this is to look at relevant trends. ‘Relevant’ here means that it has either a direct or a strong indirect effect on what you are trying to achieve. As always, it is far easier to split the 'collecting' and the 'sorting' steps. So start by collecting trends that you see evidence of in the world around you. Look at articles, forecasts, magazines, and other publications. Have a look at trendwatchers and industry reports. Try to collect as many new developments as you can find, in different areas. The checklist below can give you an idea of areas to look at.
When you're collecting, make sure you write down the sources where you found your information.
For each trend, write a post it with a recognizable label (that can be linked back to the source). stick each of post-it note on a big piece of paper or empty wall. We're clustering next, so you can already try to stick post-its that seem related close to each other.
Color code your post-its for the different areas you're gathering data on. e.g. Red for politics, green for environment, blue for technology. This will help you see patterns.
- Demographics of your customer segments
- Environment
- Politics and legislation
- Economic developments
- Competition
- Technological developments
- Consumer trends
2 Cluster Trends
Step back, and have a look at your wall. Together with your team, make an 'affinity map' or clustering of your post-its. Simply put things that seem related close together. The color code may help you here.
Are there areas you found more trends in? Or areas you had a hard time finding any? Think hard if that is an accurate reflection of the influence of the world on your business, or that it is a byproduct of the interests that are prevalent in your team. If you suspect it is the latter, make sure you either spend more time looking for relevant trends or insights, or find an expert that may give you their take on how this may influence your business. Everyone has blind spots, the point is to take action about them.
3 Select Sectors
While you can (and perhaps should) map out a Trend Canvas for each of the areas mentioned above, in most cases there are a few areas that you are more interested in right now. Select the ~3-5 areas you are most interested in for now. In the visual canvas, there are 5 sectors that you can use for these areas.
Put your Trend Canvas on the wall, and mark the 3-5 sectors by sticking labeled post-its around the perimeter of the semi-circle.
4 Map the trends
For each of the sectors, look at your trend wall. Have team members pick trends that they think are important, and put them on the Trend Canvas. They can stick them wherever they want, in the 'now', '2 years', '5 years', or '10 years' areas, and explain why they think they should go there.
When deciding how far out to place a trend, use the following principle:
- 'Now': you should see the evidence this trend impacts business all around you
- '2 years': the evidence is there, but it is still growing (fast)
- '5 years': there may be some evidence today, but it is definitely not mainstream
- '10 years': bigger movements and major future scenarios that might shape up. There may not be much evidence today.
- Have team members (or the person that did the research) give a bit of background on the trends they pick when they stick them on.
- Finally, step back with the team, and discuss the patterns you can see appearing. What are the things you already had on your radar? What are the new developments? What are positive or negative scenarios that may unfold? And how can you prepare for them?
5 Revisit
Now that you have your Trend Canvas filled, it is important to revisit it from time to time. How have your perceptions changed? Do you see new trends pop up? Also have a look at your bigger 'trend wall'.
6 Next Steps
The Trend Map by itself can be a useful tool, but it becomes much more powerful when you keep it alive and use it as a source to inform your strategy over the longer term. Make sure you stay up to date with trends. And use the Uncertainty Matrix to see which trends pack the most punch.